
A medical practice doesn’t need more reports; it needs information that supports a decision. Business intelligence for medical practices brings data from clinical, financial, and operational systems into a more coherent view, using dashboards and analytics to make patterns easier to interpret. Predictive analysis can also help teams examine potential demand and operational pressures before they shape day-to-day decisions.
It’s understandable to expect useful answers from data, yet disconnected systems and inconsistent reports can make it difficult to see what is happening across a practice. A dashboard is most useful when its measures are clearly defined and tied to questions leaders and staff need to answer.
This article explains how healthcare data pipelines and dashboards work together, which practice metrics they can surface, and how predictive analytics can inform planning. It also explores how these insights support decisions about patient access, staffing, and revenue cycle operations, without treating a trend as a substitute for professional judgment.
Key Takeaways
- Use predictive analysis to examine patterns in patient access, visit volumes, and operational demand before making planning decisions.
- Build dashboards around clearly defined measures so practice leaders can interpret clinical, financial, and operational performance consistently.
- Connect data pipelines and a centralized warehouse to bring information from separate systems into a more useful view.
- Explore how MEDITIL’s Business Intelligence & Analytics offering can help translate practice data into decision-support insights.
Predictive analytics and patient outcomes
Predictive analytics uses existing practice data to identify patterns that may inform planning and clinical review. In hospital settings, healthcare business intelligence can help providers examine potential readmission and infection rates. Teams can compare readmissions by condition or patient demographics, then investigate where follow-up or care processes may need attention. These patterns support analysis, but do not replace clinical judgment.
Length-of-stay data can add context to outcome reviews. Leaders can examine how stay duration varies by condition and compare those patterns with readmissions. The goal is to identify questions for further review, not to assume that a longer stay signals poor care. Relevant measures depend on the clinical setting and how consistently encounters are recorded.
Access measures connect operational performance with patient experience. Practices can track average wait times, scheduling lead time, and appointment availability, then examine trends by time of day or week. If waits increase during a particular clinic period, leaders can review scheduling and staffing patterns. Patient satisfaction measures can help show whether access changes address patients’ concerns.
Portals and mobile applications let patients securely access personal health information and communicate with care teams. Engagement data, such as portal use or questionnaire responses, can help teams understand how patients use these channels. Patient volume by specialty can also inform staffing plans, helping practices anticipate demand and address potential coverage gaps.
For revenue cycle performance, BI can surface claim processing time, denial rates, accounts receivable aging, and delays in posted charges. Reviewing these measures helps teams locate billing bottlenecks and prioritize workflow improvements. BI implementation costs depend on data sources, integrations, user needs, and support scope; the price depends on the case and is provided after a quote request.
Key adoption risks include inconsistent records, unclear metric definitions, and access to sensitive data. Practices can reduce confusion by defining each measure, reviewing data quality, and assigning appropriate access controls. To improve access, outcomes, and satisfaction, teams can connect wait-time and volume trends with patient feedback, then assess whether operational adjustments address the issue.
Business intelligence analytics and dashboards
Analytics turns practice data into findings; dashboards present those findings in a usable view. Together, they help teams monitor performance and identify where deeper review may be useful.
Analytics and Dashboard Functions
Analytics examines patterns across data, while dashboards organize selected measures for regular review. A practice might combine electronic health record data, financial results, and patient questionnaires to understand performance from several perspectives. A dashboard can display clinical indicators, provider activity, patient access, and revenue cycle measures. Consistent definitions help leaders and staff interpret each measure in the same way. Automated reports and real-time views can also make emerging operational changes easier to spot.
BI Platform Comparisons
There is no universally best BI platform for every practice; the right fit depends on data sources, reporting needs, and usability. EHR reporting draws on health record information, while practice management analytics focuses on administrative workflows. BI can combine EHR, financial, and operational data for a broader performance view. For example, leaders can examine provider activity alongside revenue cycle measures instead of reviewing separate reports. This matters when decisions require information from more than one system.
Implementing a BI System
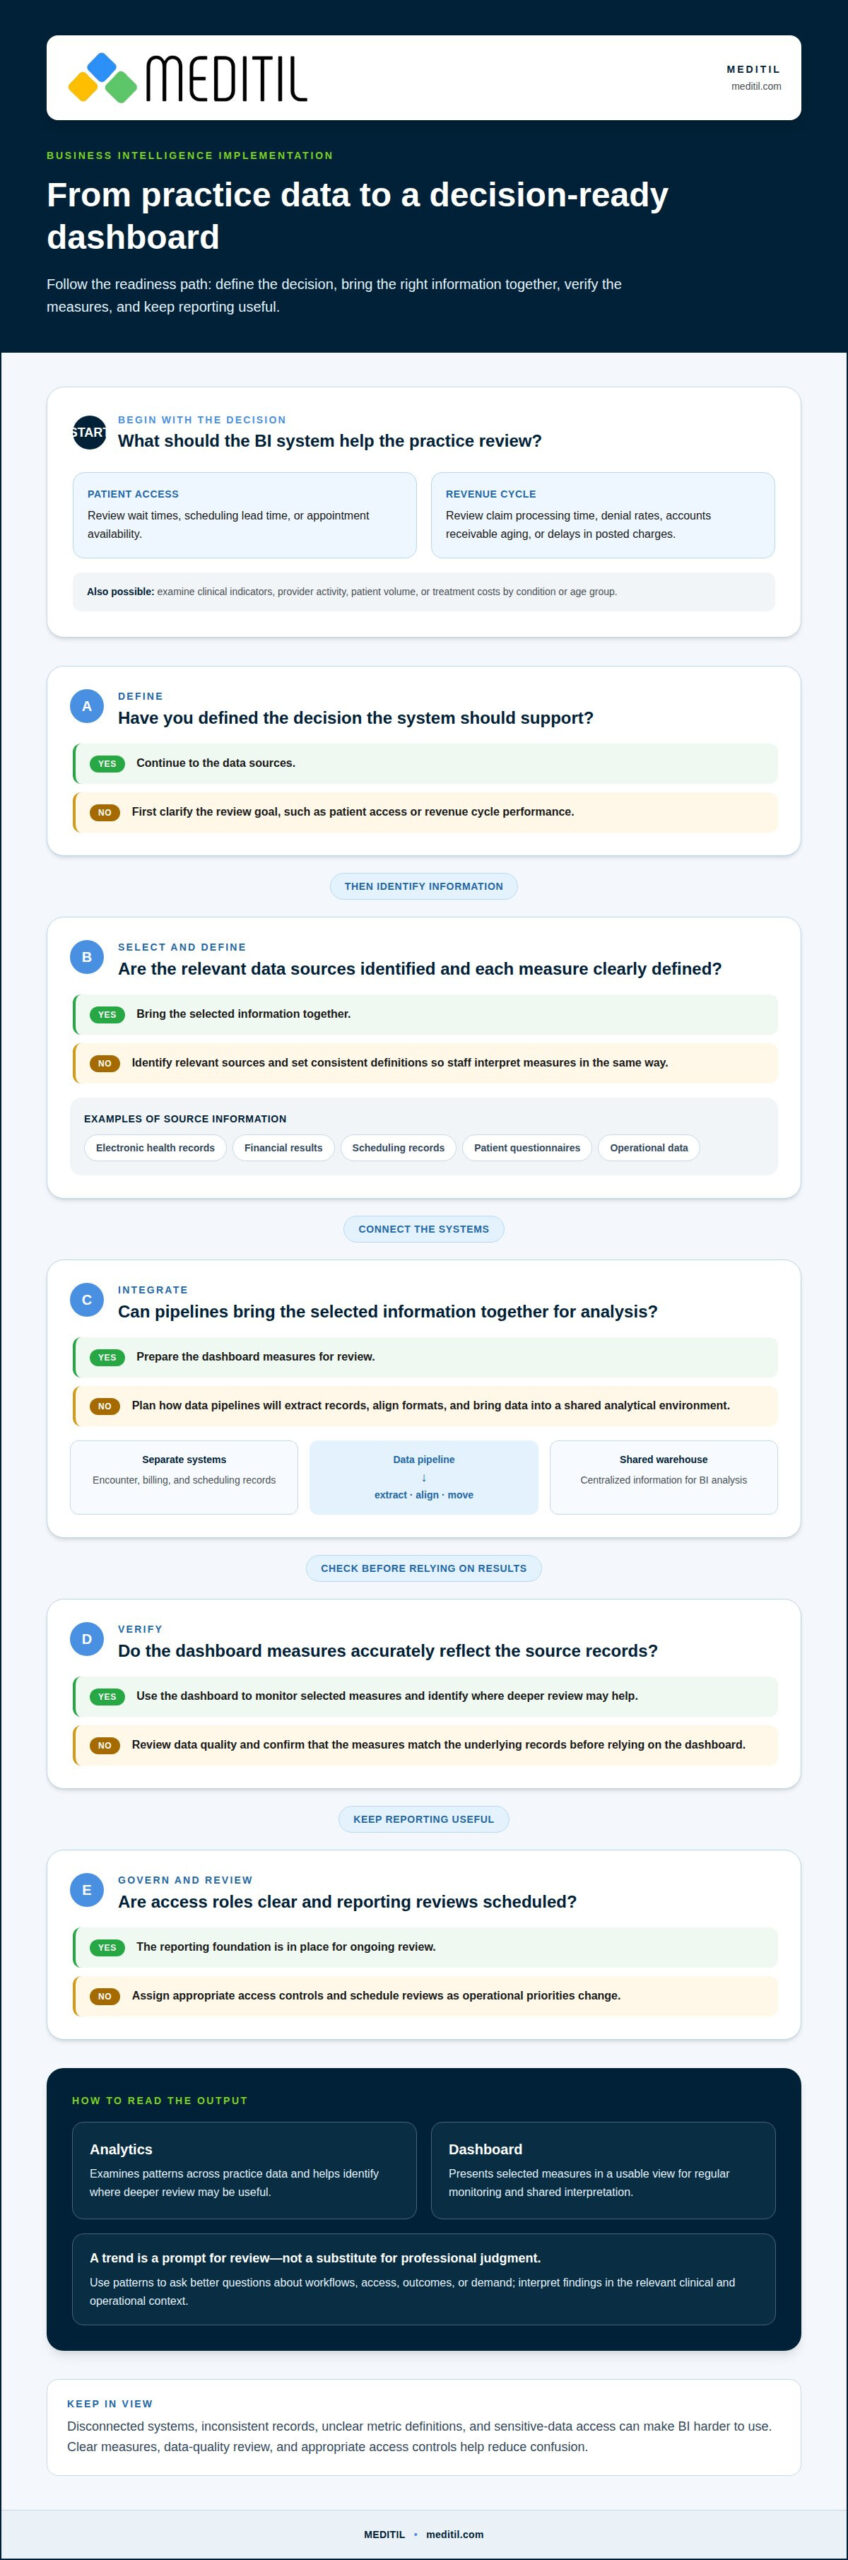
Implementation begins by defining the decisions the system should support, such as reviewing patient access or revenue cycle performance. Next, teams identify relevant sources and establish consistent definitions for each measure. Data pipelines can then bring information together for analysis and visualization. Before relying on a dashboard, teams should confirm its measures accurately reflect source records. Clear access roles and scheduled reviews help keep reporting useful as operational priorities change.
For example, a practice could use an automated report to flag changing claim denial rates, then examine the related workflow. Dashboard and data integration planning can help connect reporting needs with the systems that supply practice data.
Practices can use real-time dashboards and automated reports to gain visibility into operations and support proactive decision-making. Dashboards can also help standardize information and make it available to leaders and staff when needed.
BI visualizations and reports may draw on patient questionnaires, surveys, electronic health records, and other data sources. By consolidating electronic health record, financial, and operational data from separate systems, organizations can monitor KPIs in one view, examine treatment costs by condition or age group, and investigate unexpected costs.
Healthcare data warehouses and data pipelines
A healthcare data warehouse centralizes information so managers and analysts can use it for business intelligence. A medical practice might bring encounter, billing, and scheduling records into one analytical environment. This shared foundation lets teams examine related activity across systems rather than rely on isolated extracts. The warehouse supports analysis; it doesn’t replace the source applications used for care or administration.
A data pipeline moves information from source systems into that environment. It can extract records, align formats, and prepare fields for analysis. For example, appointment data may use different labels across systems. A pipeline can map those labels to a consistent definition before reporting. If a field is missing or duplicated, validation steps can flag the issue instead of quietly distorting a result.
Reliable reporting depends on the meaning and timing of each data element. A practice should define measures such as completed visits and posted charges, then document which records count. It also needs to set how often data is refreshed based on the decision being supported. A daily operational view and a historical financial analysis may need different refresh schedules.
For U.S. practices, BI workflows that handle identifiable health information should be assessed against applicable HIPAA privacy and security requirements. Design decisions should account for what information enters the warehouse, which roles can access it, and how it is protected during transfer and use. For example, a staffing report may need aggregate visit counts rather than patient-level details.
Data lineage makes results easier to investigate. It records how a dashboard measure connects to source records and transformation rules. If a report shows an unexpected change in posted charges, analysts can trace the measure through the pipeline and inspect its inputs. Assigning ownership for data quality, access, and pipeline issues helps teams resolve discrepancies and maintain confidence in operational reporting.
What data sources and metrics do medical practice BI tools track?
Medical practice BI draws on clinical, scheduling, billing, and financial records. Combining these sources helps teams connect activity that separate reports can obscure. For example, encounter records can be compared with submitted claims to examine encounter reconciliation. Scheduling data can be viewed alongside completed visits, helping leaders interpret changes in volume and provider activity. The value comes from choosing measures that answer specific operational questions.
Revenue cycle metrics show where billing work may be slowing or balances remain unresolved. Practices can track claims billing, claim processing times, denial rates, payment posting, and accounts receivable aging. If aging balances rise, teams can examine which accounts remain outstanding and where follow-up may be needed. Delays between a visit and posted charges can also reveal workflow bottlenecks. Comparing measures over time helps distinguish a recurring process issue from a one-off result.
Provider and patient access measures add another view of practice operations. Average claim processing time and denial rates indicate revenue cycle performance, while appointment availability and wait-time trends help assess access. Relative value units by provider can support productivity benchmarking and inform compensation models. Visit volumes across specialties can help leaders consider demand, resource allocation, and scheduling. These measures need clear definitions, since comparisons lose meaning when teams count encounters or completed visits differently.
Useful analysis links a metric to a decision. For instance, a practice reviewing delayed charge posting can compare the delay with encounter reconciliation and billing workflow stages. That view can help staff focus process reviews where delays appear. Similarly, combining provider activity with claims performance gives leaders context beyond a single productivity measure. Select measures that match practice priorities, then assign clear ownership for interpretation and follow-up. Discuss practice data and analytics needs to connect reporting priorities with operational decision-making.
Medical practices can use business intelligence to analyze encounter reconciliation, claims billing, claims processing times, outstanding accounts receivable, and payment posting. Tracking delays in posted charges can help physician practices identify billing workflow bottlenecks and improve processes. Monitoring accounts receivable aging can help identify overdue balances and prompt corrective action. Together, these measures support focused operational review.
MEDITIL: Business Intelligence & Analytics
MEDITIL helps medical practices turn operational and clinical data into insights through Business Intelligence & Analytics. This can be a useful next step when information is spread across separate systems, reports are difficult to reconcile, or leaders need clearer measures for planning. The work aligns reporting priorities with the data sources and workflows that support practice decisions.
When the underlying environment needs attention, Managed IT Services (Ongoing) and Infrastructure & Network Services can support the technology foundation. MEDITIL’s HIPAA-compliant Cybersecurity & Compliance services address security and compliance needs across healthcare IT. The right focus depends on the practice’s reporting goals, current systems, and operational priorities.
To discuss how analytics could support your practice’s decisions, contact MEDITIL.
Turn practice data into a clear next step
Connect analytics work to a decision your practice needs to make. Choose a priority, define what a useful answer would look like, and align the people and technology responsible for acting on it. A focused starting point can help teams build confidence in their reporting before expanding its scope. A deliberate approach to business intelligence for medical practices keeps the work tied to operational needs, not dashboards alone.
MEDITIL can support that effort through Business Intelligence & Analytics, with Managed IT Services (Ongoing), Infrastructure & Network Services, and Cybersecurity & Compliance addressing related technology needs. If you’re ready to discuss how these capabilities could fit your practice, contact MEDITIL to discuss your needs. A practical first conversation can help clarify the decisions, systems, and priorities that should shape your next step.
Frequently Asked Questions
What is business intelligence for medical practices?
Business intelligence for medical practices means using organized practice data to support operational and strategic decisions. It helps teams move beyond isolated reports by giving information a consistent structure and context. For example, leaders comparing results across reporting periods need shared definitions for measures such as completed visits. That consistency makes it easier to interpret changes and decide what deserves further review.
How much does BI software for medical practices cost?
Costs depend on data sources, integrations, user needs, and support scope. Pricing is provided after a quote request.